Nectar Diagnostics
Offering exceptional network health by enabling complete IP network information correlation and comprehensive cross-platform insight
Nectar Diagnostics utilizes cutting-edge, probe-based analyzer technology to fill in manufacturer ‘blind spots’, thereby creating real-time, complete call diagnostics for every session, regardless of platform or client type.
TEXT NEEDED
TEXT NEEDED

Real-Time Quality
The true value of Nectar Diagnostics is that it sees and reports on how the actual packets of a conversation are being handled on the network, and notifies you – in real-time – exactly how the network treats an individual user’s conversation.

SDN API Integration
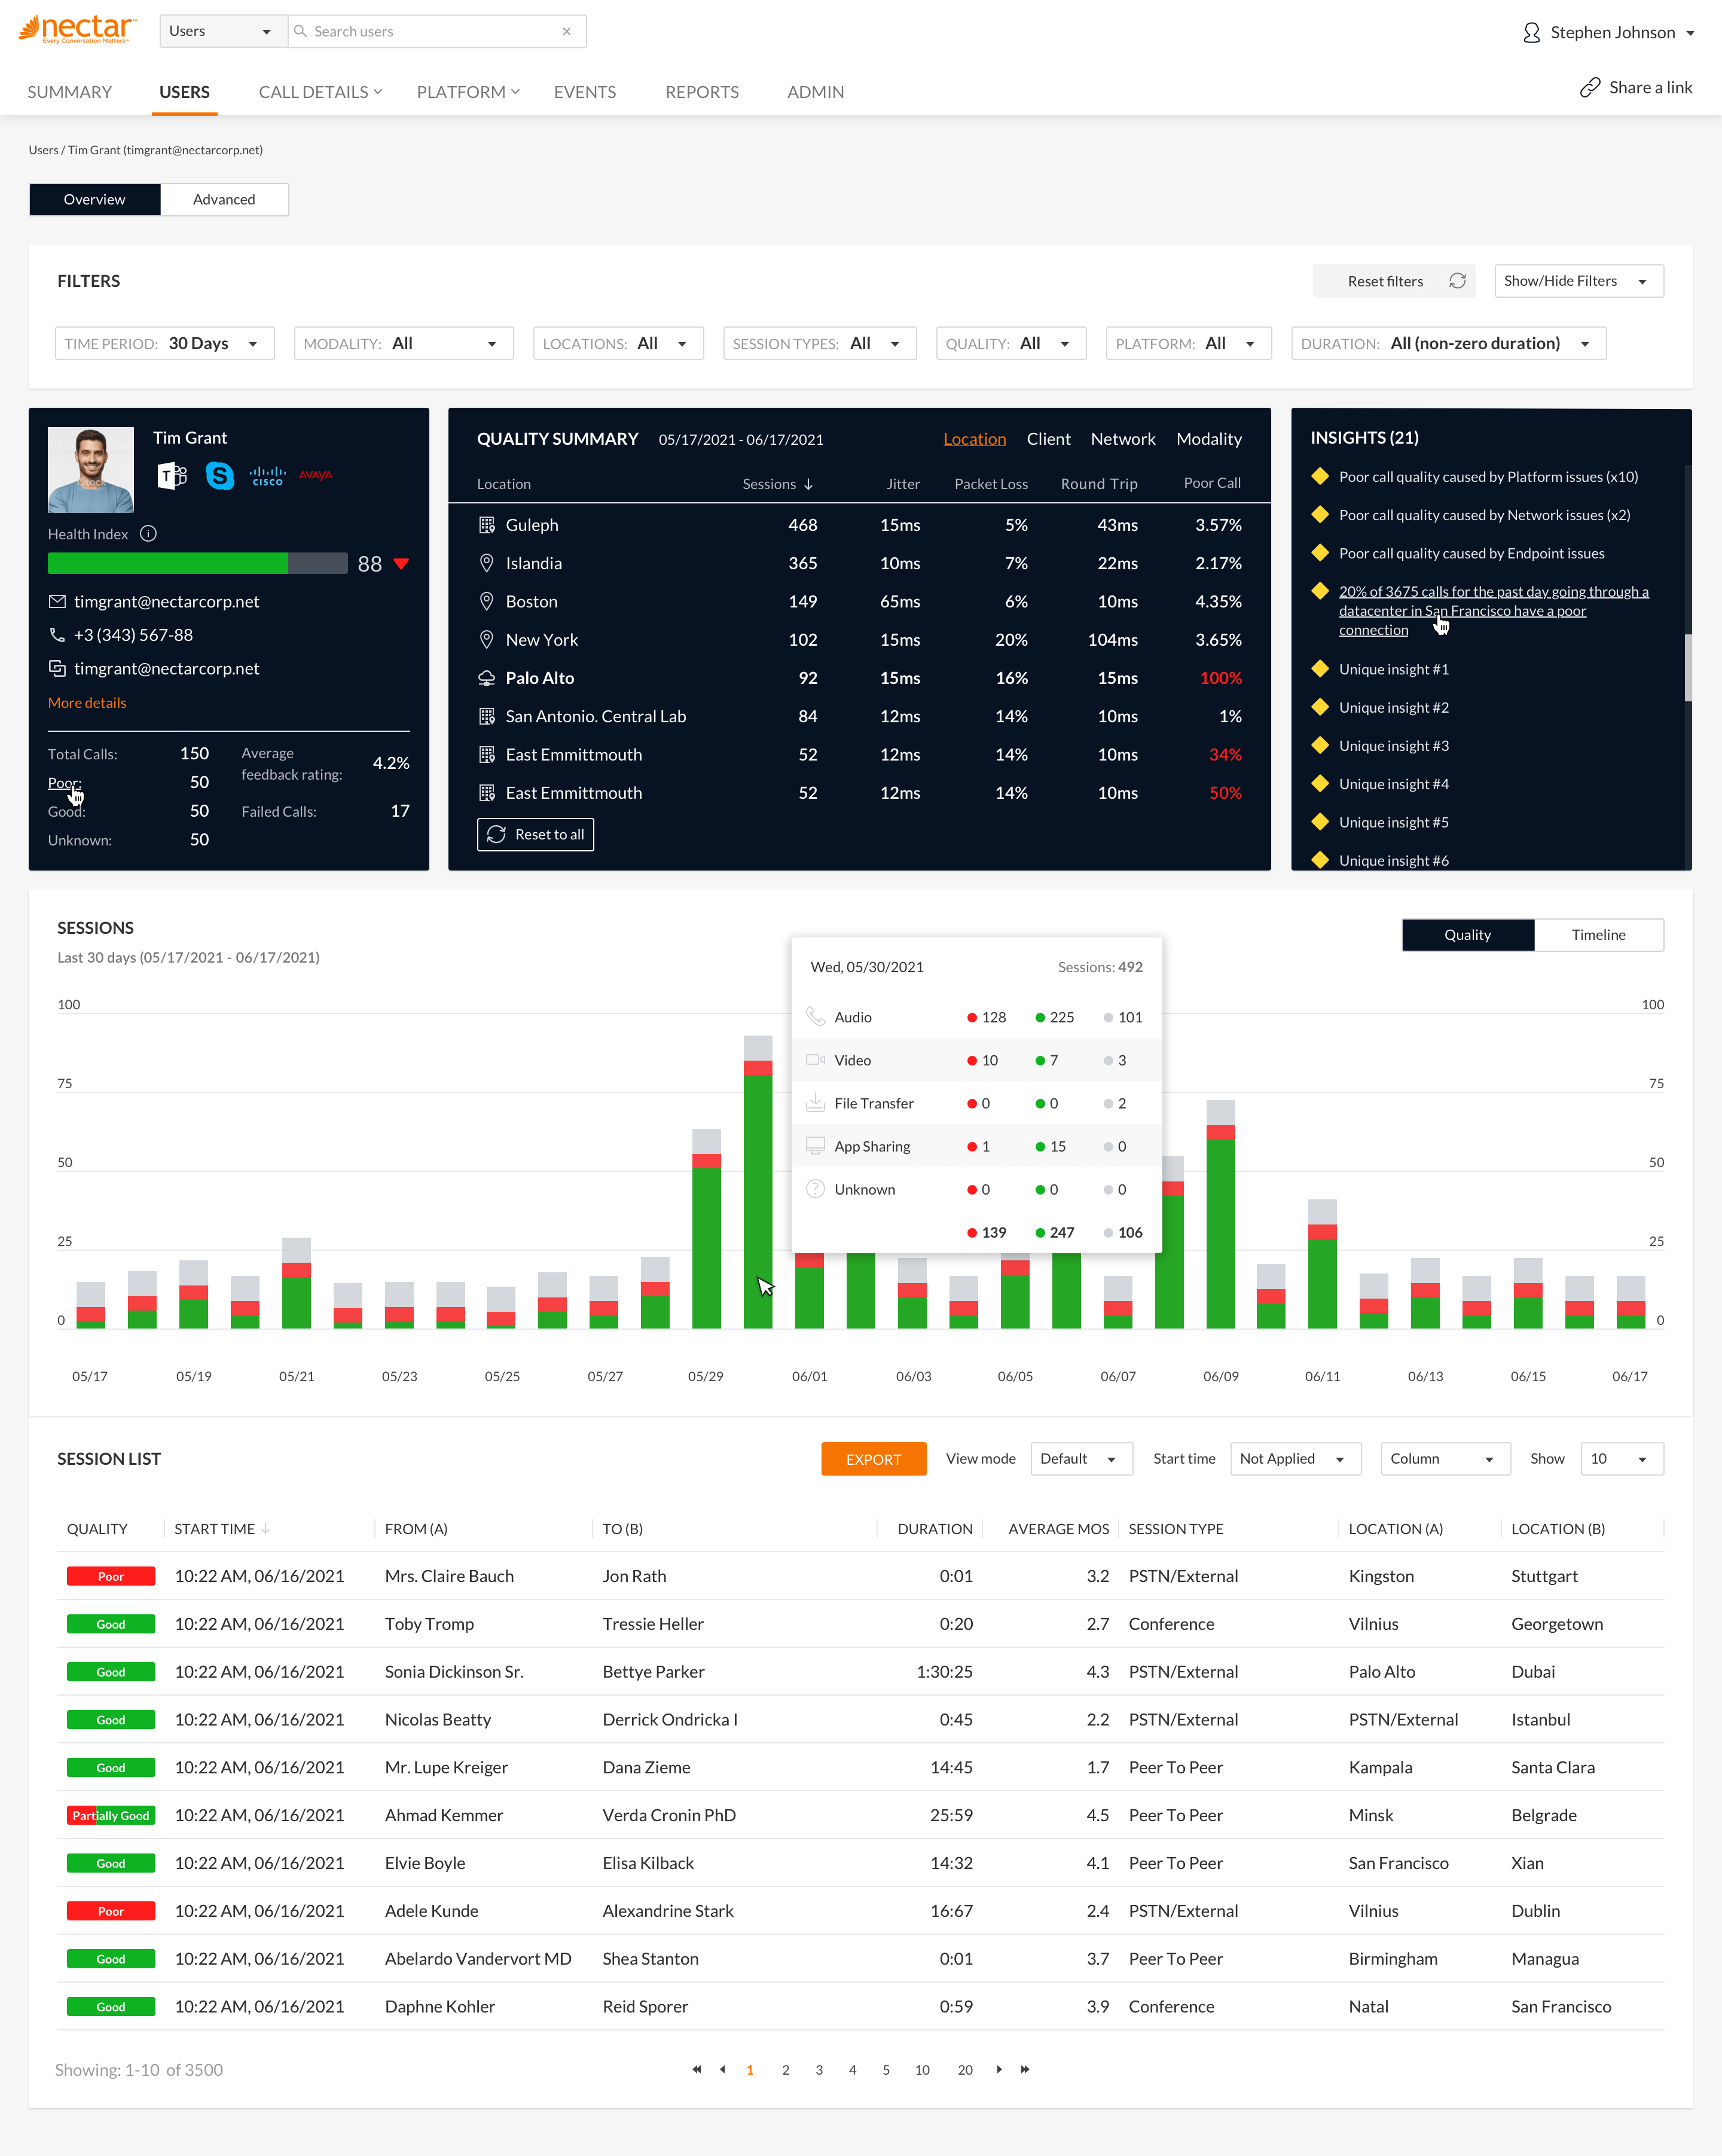
Nectar Diagnostics provides proven integration of Microsoft, Cisco and Avaya UC networks via a single monitoring solution. It speeds the adoption of Microsoft Skype for Business and Teams deployments and saves you time, resources, and money.

Robust Reporting
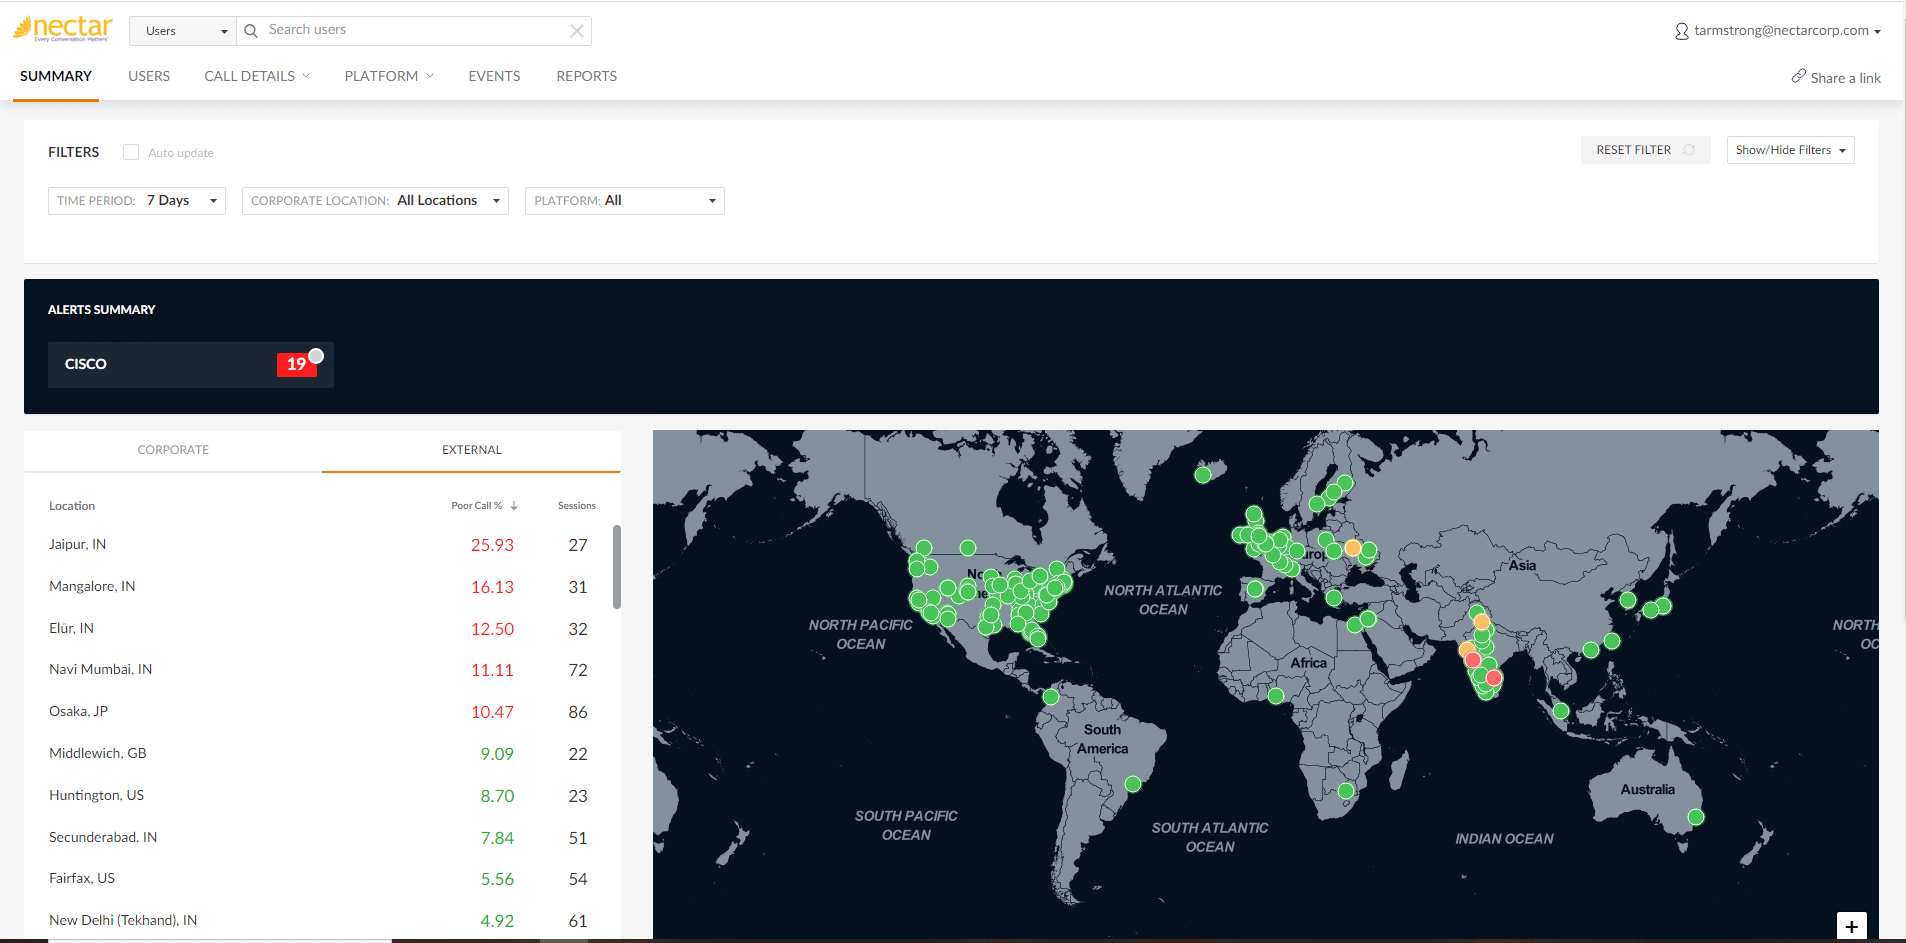
Visualization of historical trends allows for executive-level tracking, management, and decision making in order to improve the user’s experience and anticipate operational requirements such as capacity planning.
The Nectar Difference
Real-Time Media Monitoring
Instant visibility and analysis of active calls to demonstrate the true end-user experience, including fault isolation to quickly ‘bracket’ the source of performance problems.
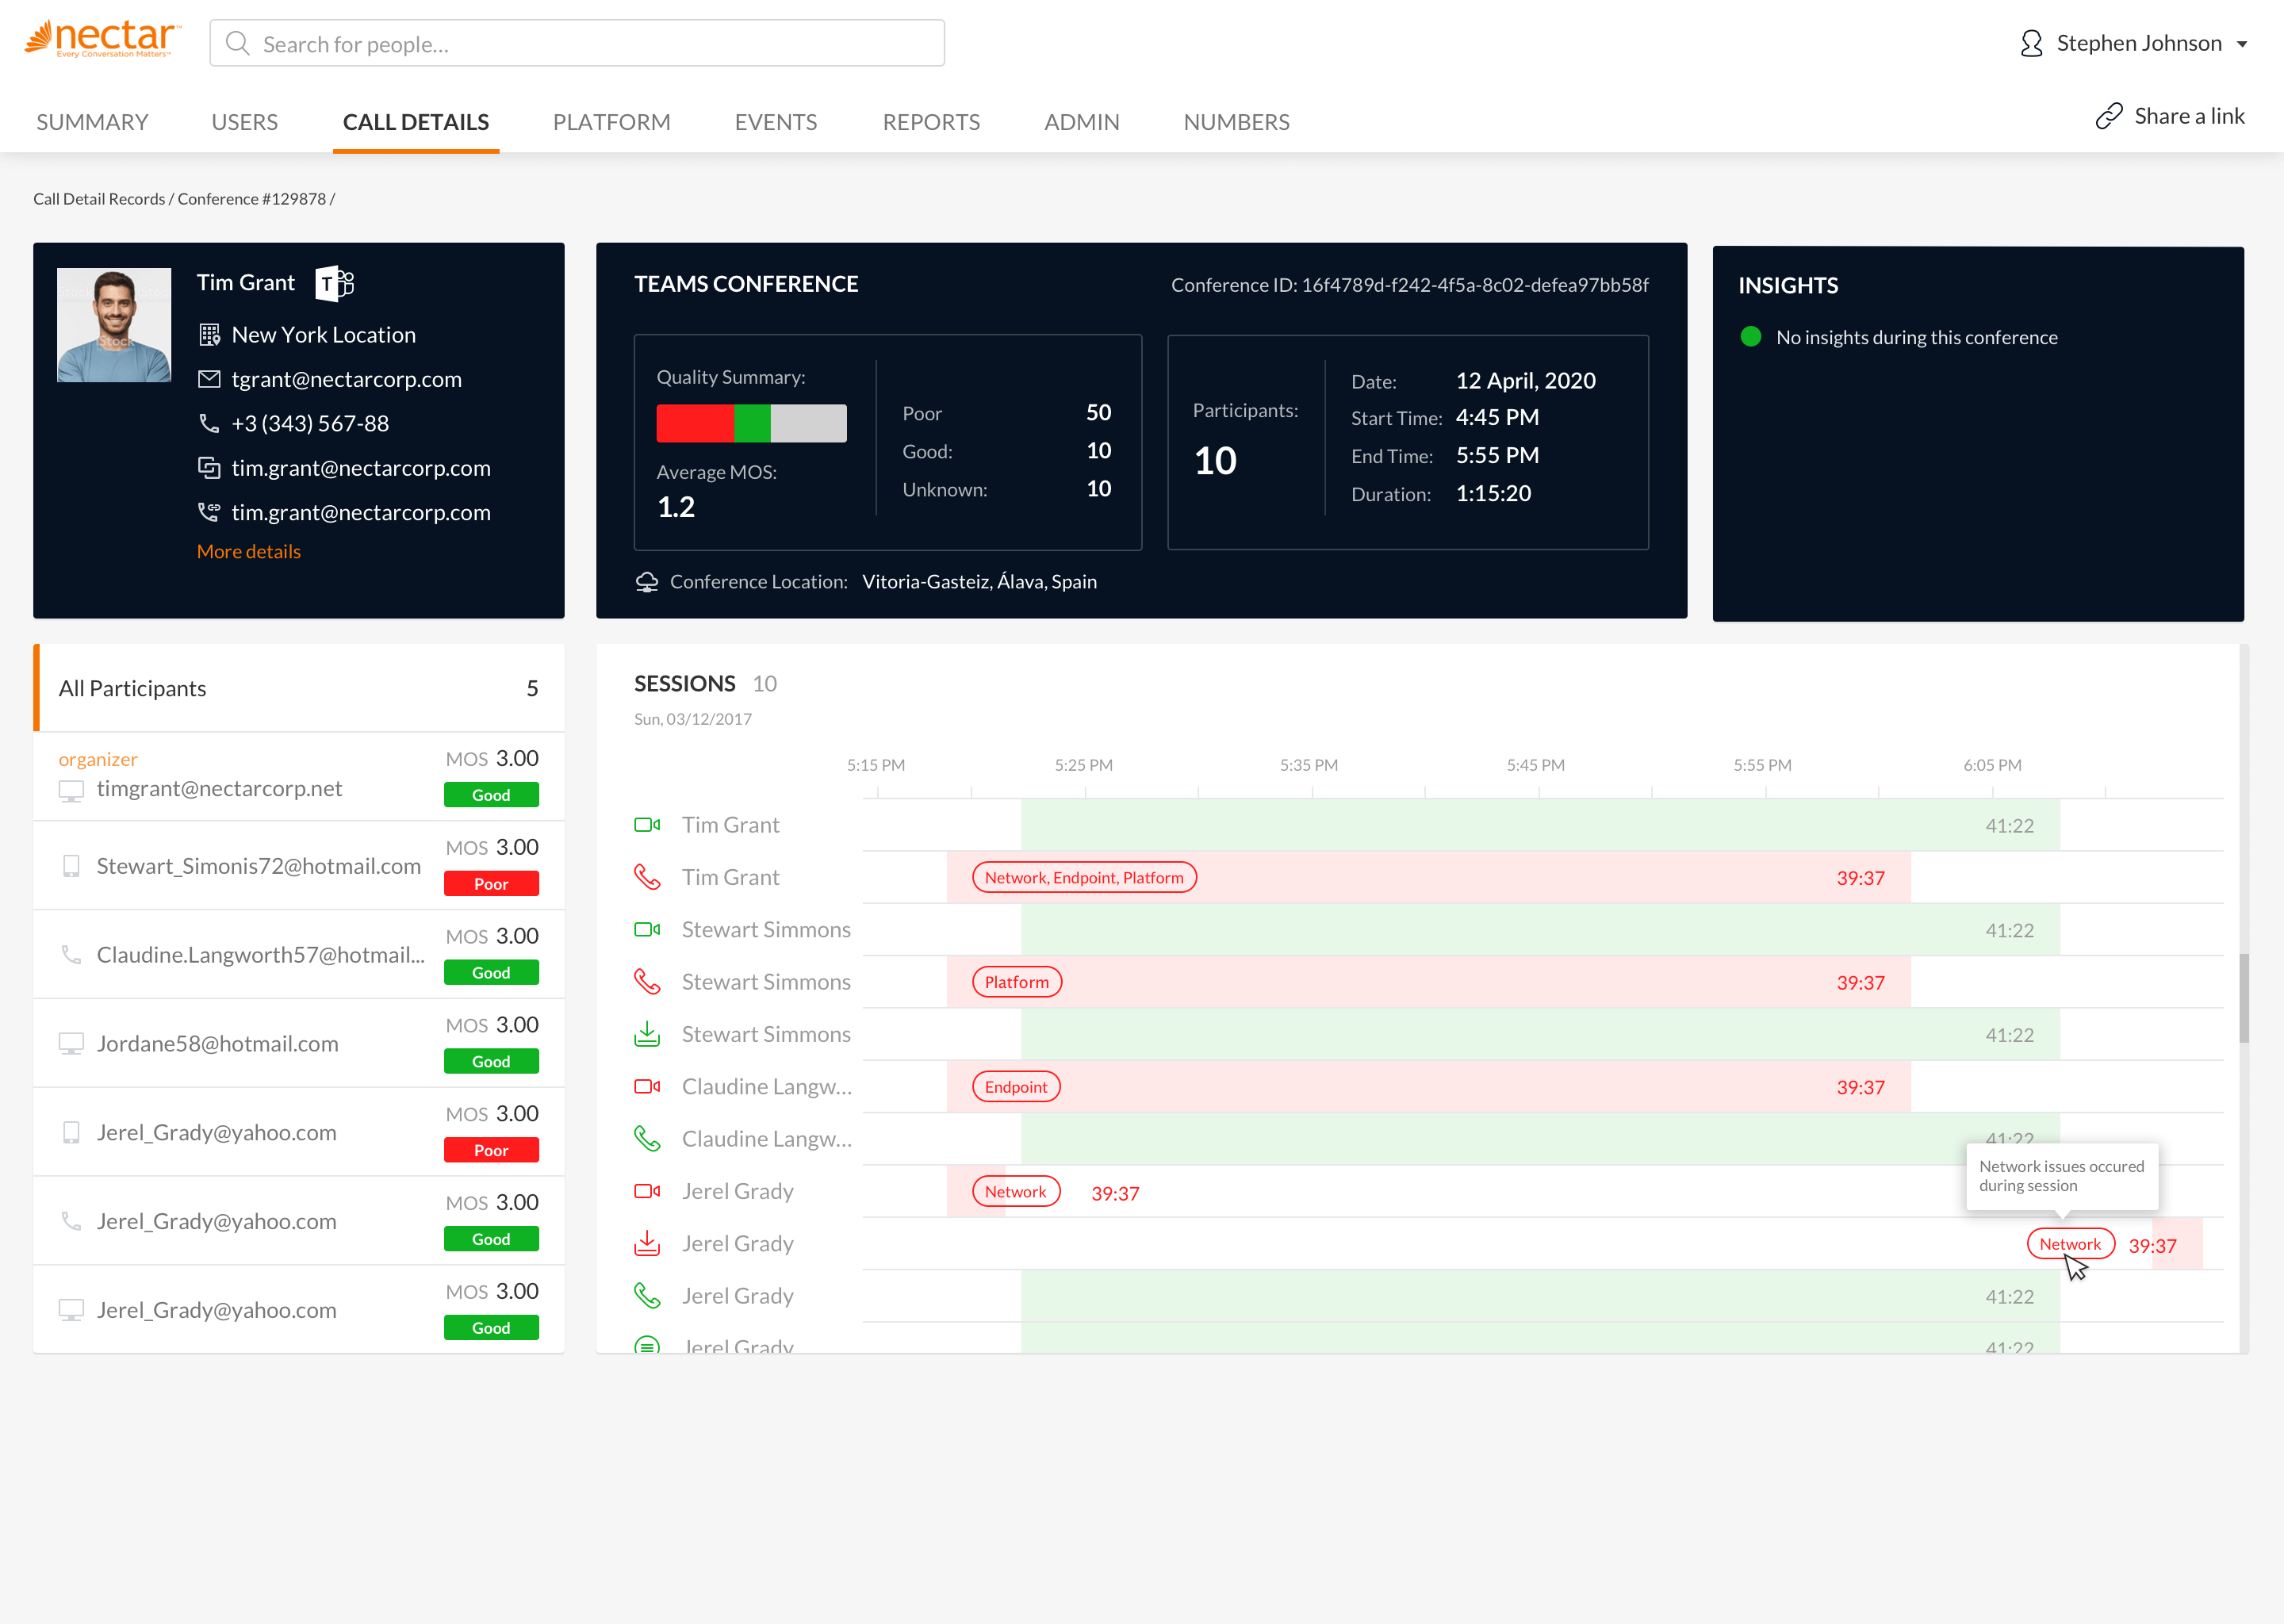
Signaling Analysis
Enables site-based session tracking and reporting to help identify systemic vs local failures with insights into Complex Call Flows allowing for rapid identification of all legs of a call.
Network Path and Event Correlation
Identifies poor call quality causes and provides immediate notification of relevant network events while showing the network path of each media session by router and audio packet monitoring.
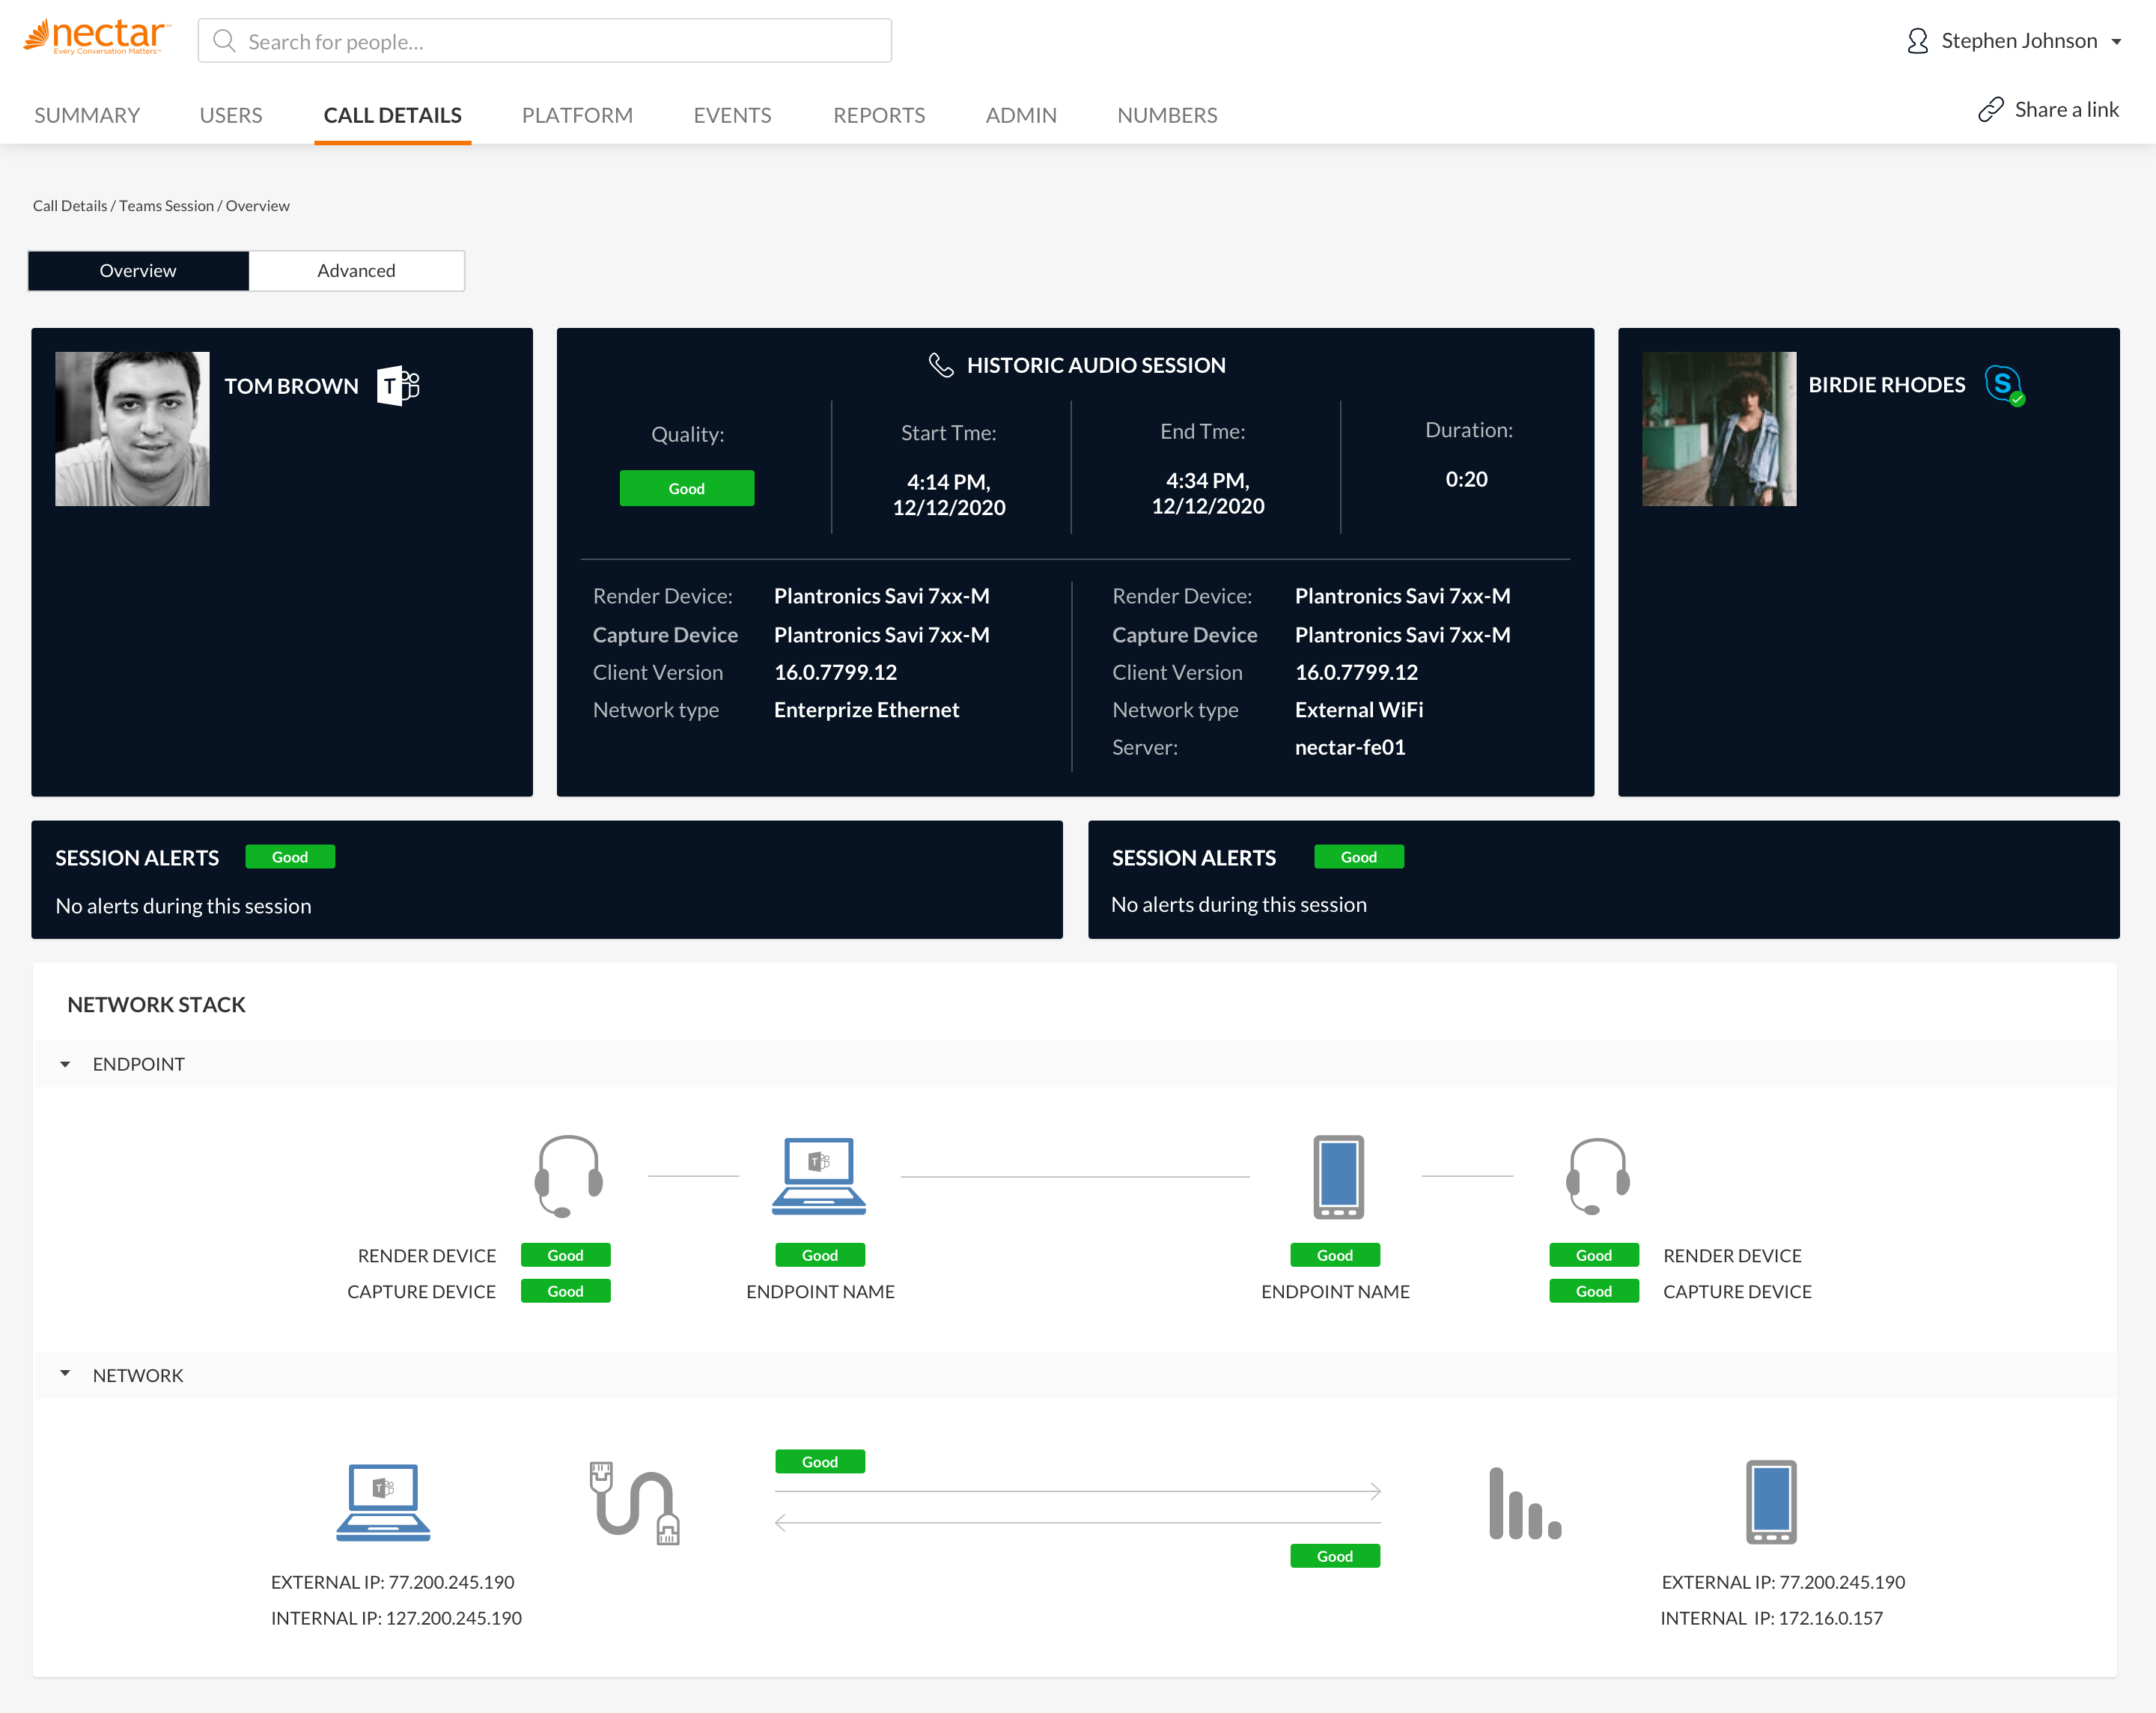
GUI and System Management
Pulls together all Diagnostics capabilities via a comprehensive, correlated ‘single pane of glass’ view, providing an easy-to-interpret presentation of all events and user experience metrics.